Hands-On Data Visualization - by Jack Dougherty & Ilya Ilyankou (Paperback)
$36.49Save $29.50 (45% off)
In Stock

Free & easy returns
Return this item by mail or in store within 90 days for a full refund.
Eligible for registries and wish lists
About this item
Additional product information and recommendations
Discover more options
- $38.70MSRP $59.99
- $52.52MSRP $79.99
- $45.70MSRP $79.99
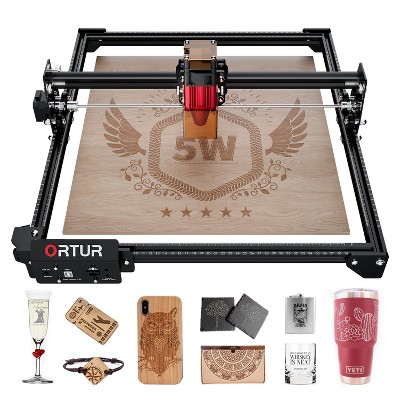
- $46.99MSRP $59.99
- $57.96MSRP $79.99
- $55.47MSRP $79.99
- $47.95MSRP $59.99
- $49.20MSRP $69.99
- $45.20MSRP $79.99
- $50.99MSRP $79.99
- $38.31MSRP $59.99


Frequently bought together
- $27.69MSRP $35.00
- $11.02MSRP $18.99
- $127.25MSRP $164.00
- $20.54MSRP $30.00
- $18.63MSRP $19.99
- $37.44was $46.28 New lower price
- $17.64MSRP $28.95


Best-selling Computers & Technology Books
- $9.99MSRP $21.00
- $17.69 - $18.81MSRP $20.00 - $32.00 Lower price on select items
- $17.91MSRP $32.50
- $28.42was $34.38 New lower price
- $9.40was $10.60 New lower price
- $37.99 - $39.49MSRP $59.99 - $69.99
- $16.99MSRP $29.99
- $27.53MSRP $49.99